
For the last couple of years we have been working with Sea3R a Rotterdam based company that quantifies operational risk for shipping fleets.
Sea3R approached us to help analyse the large volume of historical data from the global shipping Automatic Identification System (AIS) to provide operational risk assesments and fleet utilisation for their clients. We were already familiar with the data, due to our work pricing marine hull insurance, but had not previously worked with it at scale.
Over the course of the engagement, we’ve become very familiar with AIS data, and have developed our own suite of tools and techniques to analyse it at scale and over long time periods.
The data is large, millions of records per day, and needed to be combined with several external data sources, to generate the risk and utilisation data.
Although this work was aimed at gving shipping fleets operators an overview of their assest we knew that there would be many uses for this analysis in insurance.
This data and analysis is ideal for pricing, underwriting and exoposure analysis, as it provides a detailed picture of the movement of ships, the type of cargo they transport, and the amount of time spent at each port and in transit.
We recently presented this work at the Insurance Data Science Conference in London where it was well received.
The primary aim of the exercise it to give shipping fleet operators a way to see the movement of their assets over time. Although shipping fleet operators have acccess to this data, they were not able to do so at scale and so did not have a detailed overview of their assets and how they were behaving over time.
We used a combination of tools, including Azure Data Factory and R to load the data, clean it and transform it to produce a series of visualisations. We are primarily interested in the movement of ships over time and how they are moving between ports, regions and countries around Europe over the year 24/25. We also we interested in ships that are at the smaller end of the classifications as this data had not been investigated in detail.
For the purposes of this anaysis we have divide the shipping market into the following categories:
Ships can also be classified by cargo type, whether they are a “container ship” or a “bulk carrier” and whether they are gearless or not. We can also aggregate the data into owners and operators to see how various fleets are moving over time.
Below is one of the visualisations produced, showing the movement of Large Ship ships over 2024 and 2025 around Europe.
The colours show the movement of ships withing separate geographic areas.
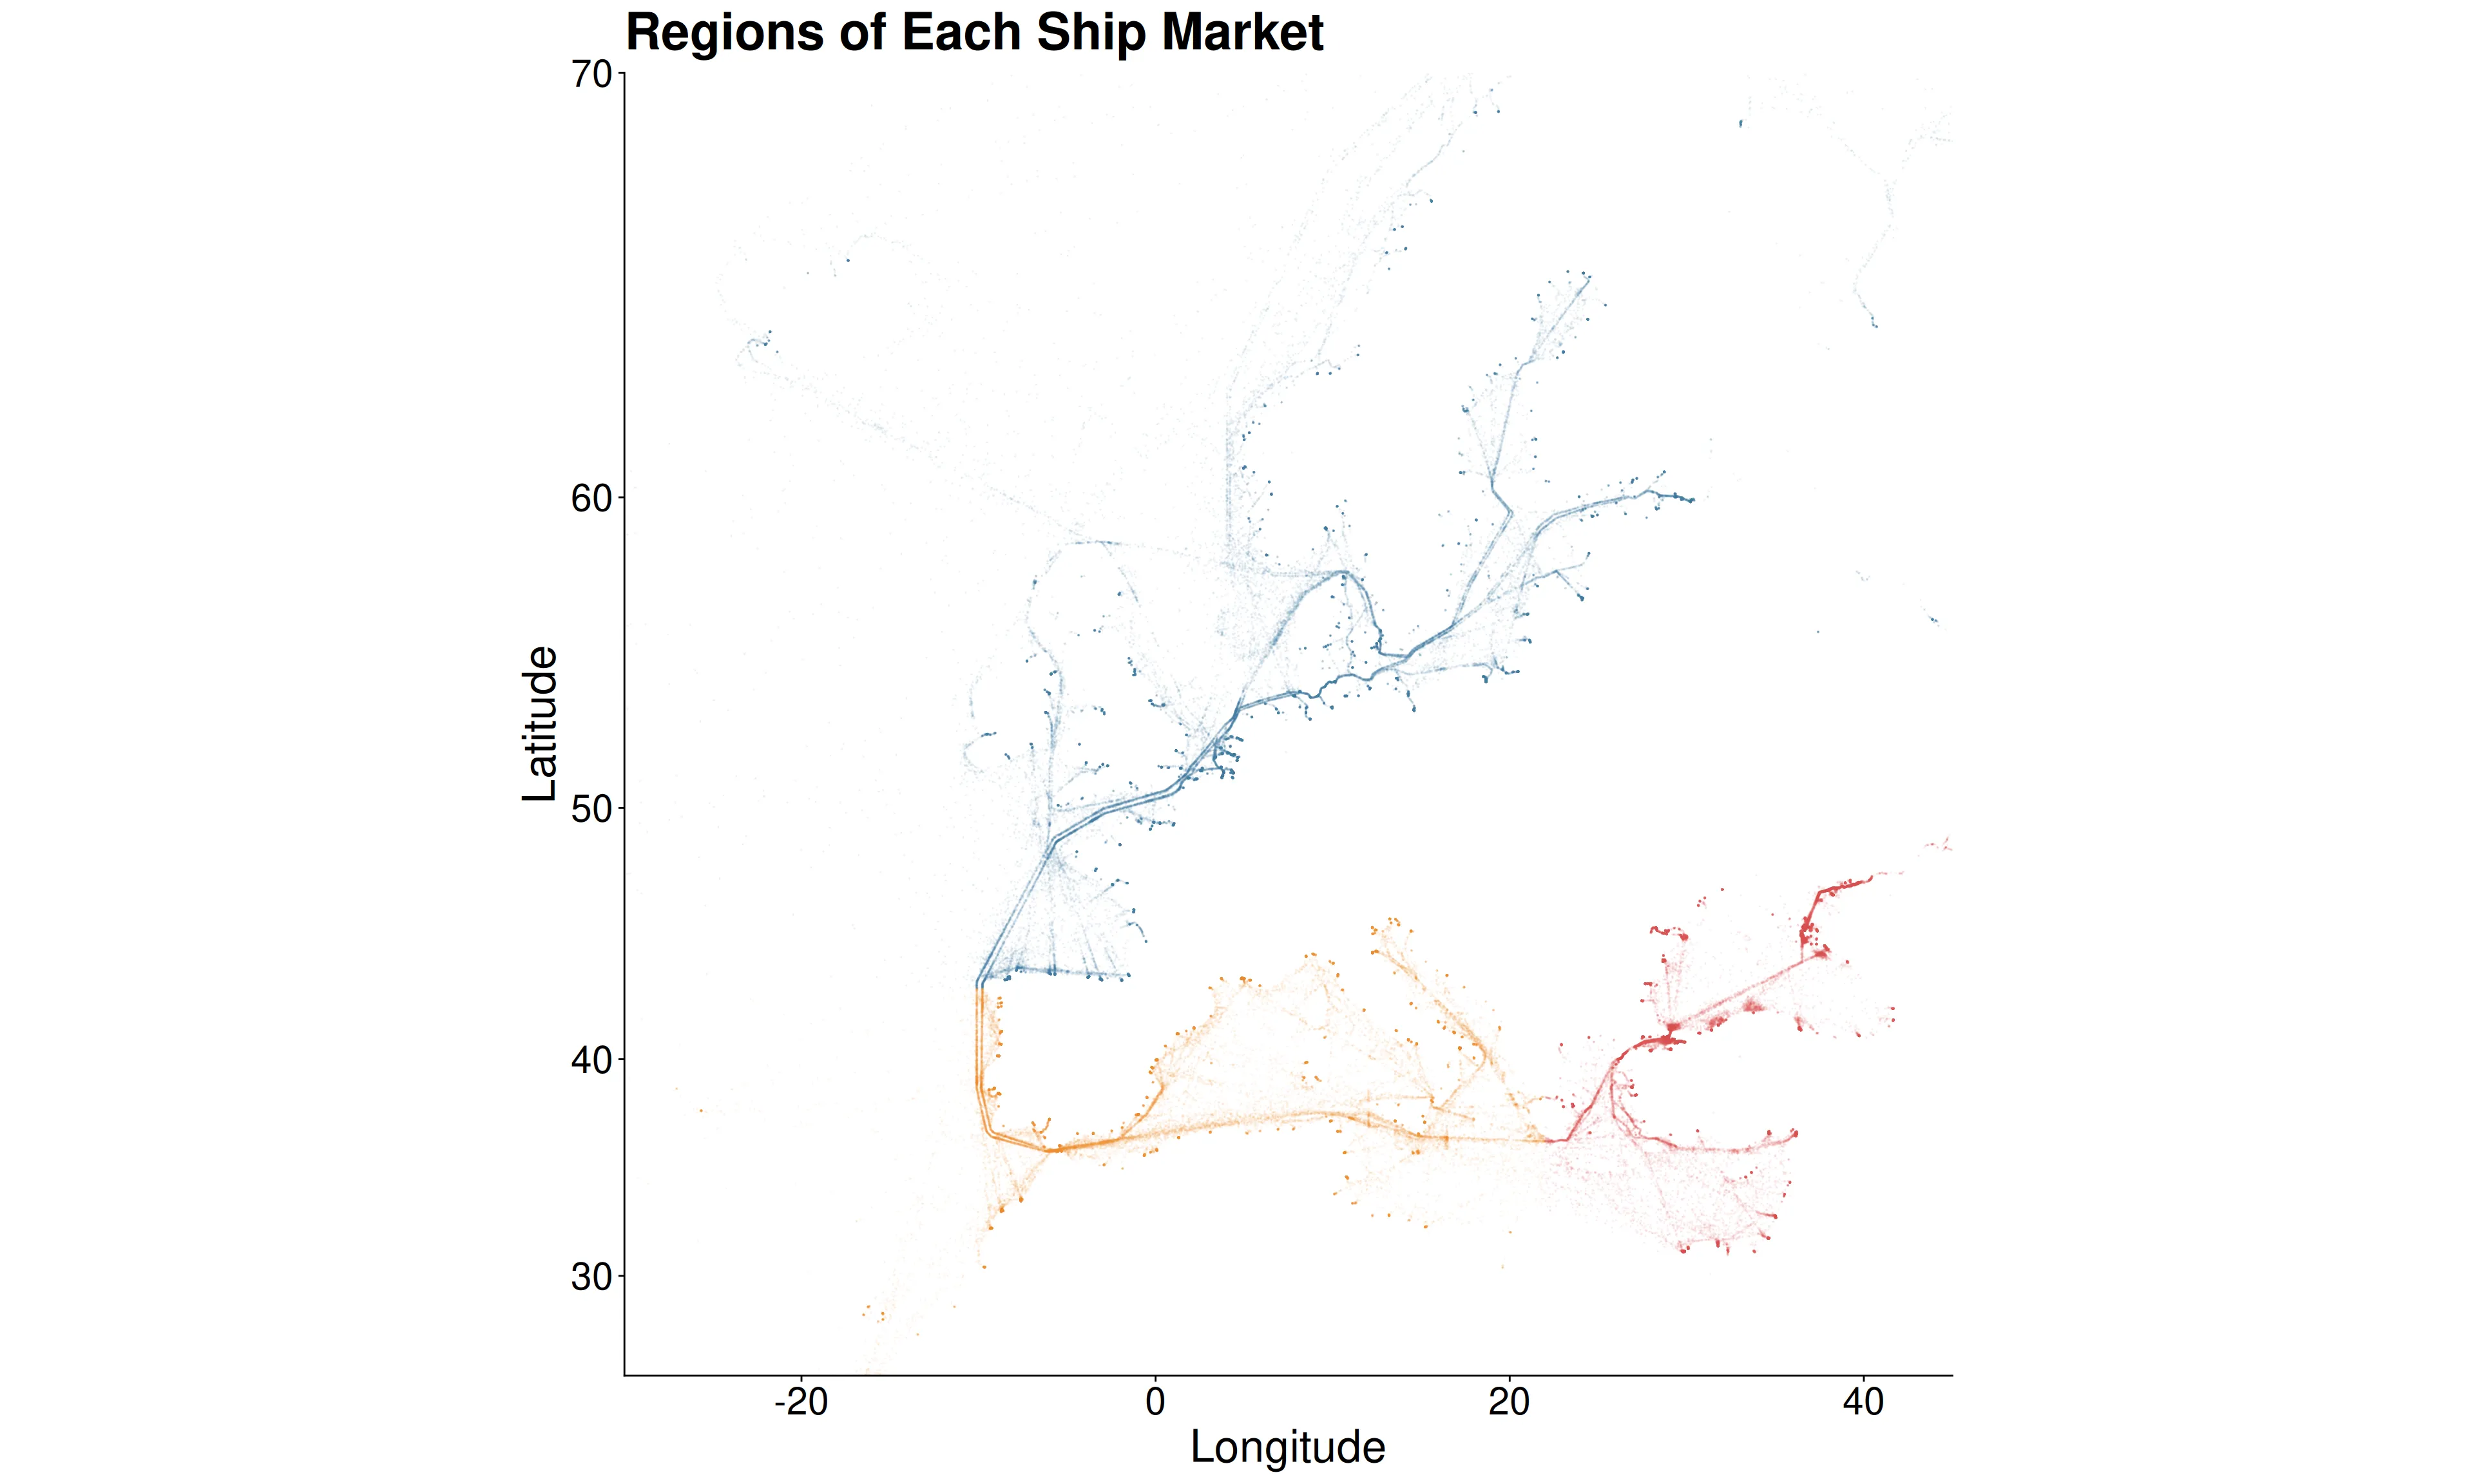
As pretty as this looks, there is a lot of detail in the data here and we can drill down to see the movement of each vessel, or a fleet of vessels over the year.